|
|
|
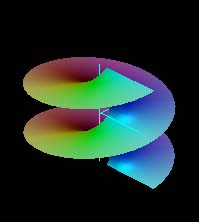
| y = ex | x = Re(eiy) = cos y | x = Im(eiy) = sin y |
|
|
|
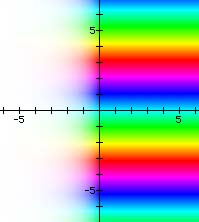
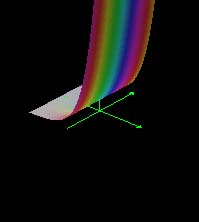
| Color map | Discrete color map | Color coded surface |
|
|
|
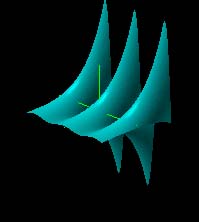
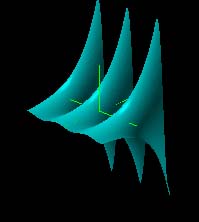
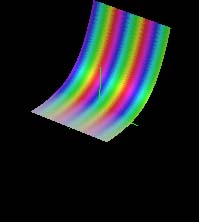
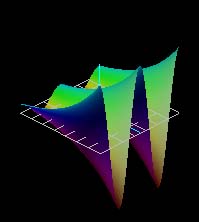
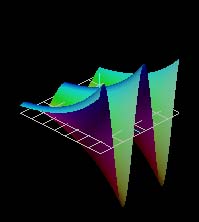
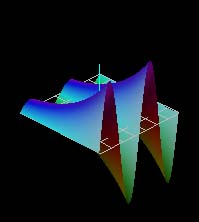
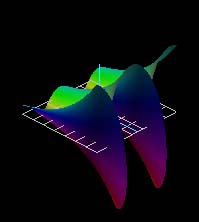
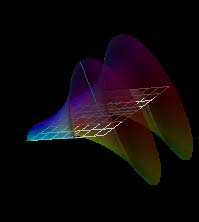
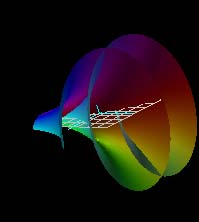
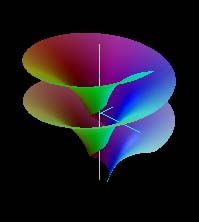
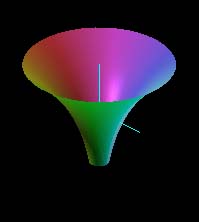
| Re(ex+iy) | Im(ex+iy) | |ex+iy| |
|
|
|
|
|
|
|
|
|
| In Four Dimensions | ||
|
|
|
|
|
|
| Conformal maps |
If you have installed the free viewer, clicking on an image above will open a corresponding document.
In the color maps, hue indicates phase, saturation and lightness indicate magnitude. Real values are cyan, pure imaginary values are red. In general, one can see the sinusoidal variation along the imaginary or y-axis and exponential variation along the real or x-axis.
