 |
 |
 |
 |
 |
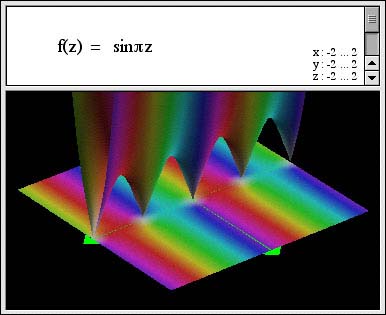
Color coded surfaces of a function of a complex variable
A complex function of a complex variable can be drawn as a surface in 3D. In the image above, the height of the surface represents the magnitude of the complex sine function, while the color encodes its phase.
